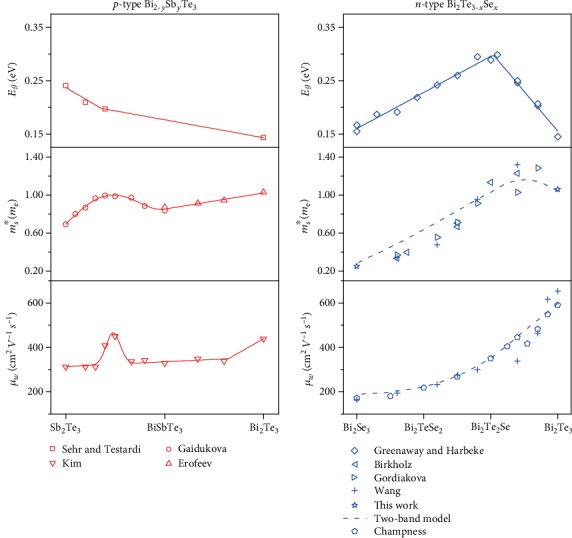
Figure 2.

The band gap and electronic transport in p- and n-type bismuth telluride alloys show important differences in compositional trends due to the details of their complex band dynamics. In Bi2−ySbyTe3, a change in slope of the band gap with composition coincides with a peak in Seebeck mass and weighted mobility when modeled using a single band [6, 13–15]. This correlation is explained by a crossing of two valence bands in energy with composition [13]. In Bi2Te3−xSex, a peak in band gap does not coincide in composition with the peak in effective mass and no peak in weighted mobility is observed [4, 8, 16, 53, 54]. This suggests that the underlying causes differ for the mass and band gap peaks. The solid lines in this figure are simple guides to the eye, while the dashed lines represent single band evaluation of the simplified two-conduction band effective mass model discussed within the text and evaluated for a constant doping level of 5∗1019 cm−3.
