Figure 3.

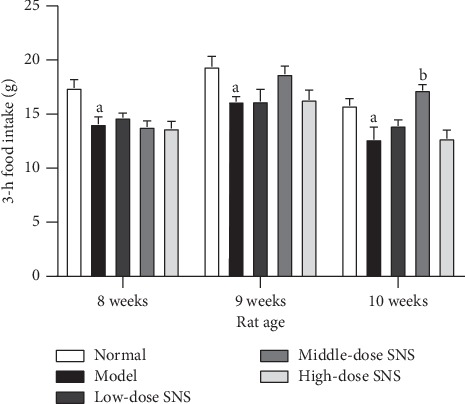
The 3-h food intake of rats at the age of 8 weeks, 9 weeks, and 10 weeks. Data are expressed as mean ± SE and n = 6/group. aP < 0.05 vs. control group, bP < 0.001 vs. model group.

The 3-h food intake of rats at the age of 8 weeks, 9 weeks, and 10 weeks. Data are expressed as mean ± SE and n = 6/group. aP < 0.05 vs. control group, bP < 0.001 vs. model group.