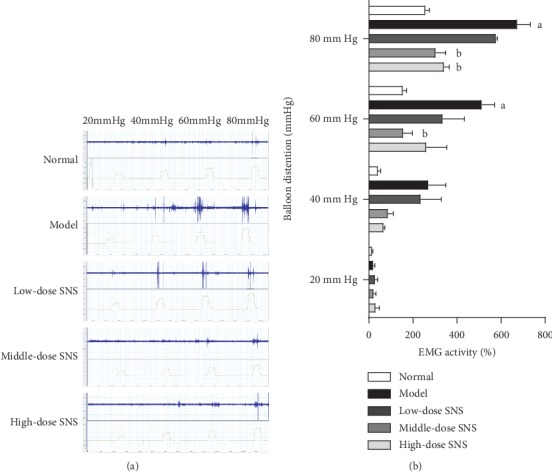
Figure 4.

Effects of SNS on the EMG activity in rats. (a) Representative photographs of EMG records under graded gastric balloon distention. (b) Quantification of EMG activity (the rate of change of RMS value of the EMG signal). Data are expressed as mean ± SE and n = 6/group. aP < 0.01 vs. normal group with the same graded distention; bP < 0.01 vs. model group with the same graded distention.
