Figure 6.

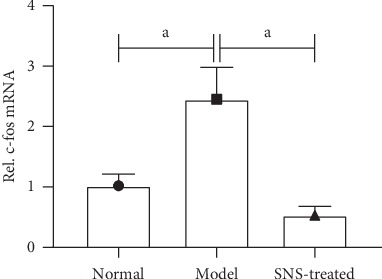
Effect of SNS on the expression of the c-fos gene in FD model rats. The Level of c-fos gene was determined using real-time quantitative PCR. Data are expressed as mean ± SE and n = 4/group. aP < 0.001.

Effect of SNS on the expression of the c-fos gene in FD model rats. The Level of c-fos gene was determined using real-time quantitative PCR. Data are expressed as mean ± SE and n = 4/group. aP < 0.001.