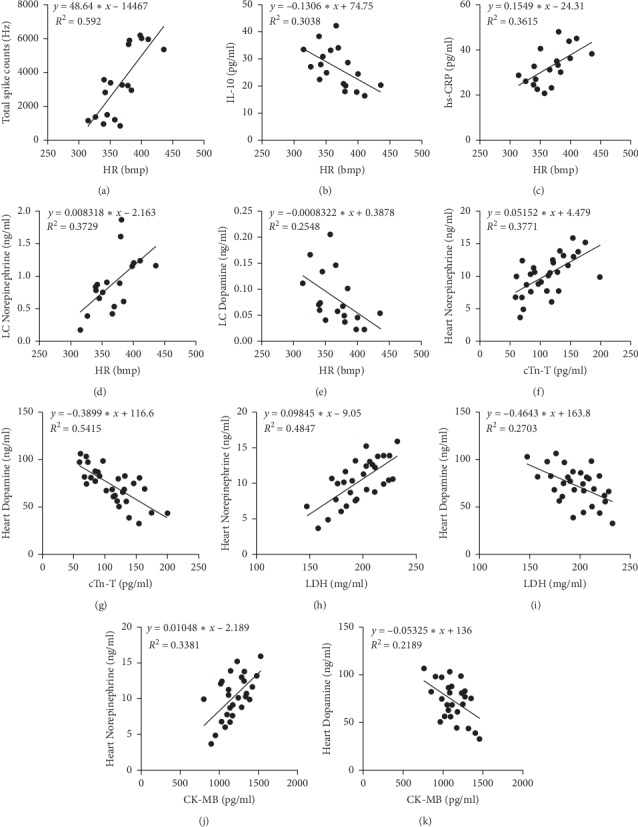
Figure 6.

Correlation analysis. “(a)” HR is correlated with the total discharge frequency of the neurons in the LC (P < 0.01, r = 0.7755). “(b)” HR is correlated with IL-10 (P < 0.01, r = −0.5511). “(c)” HR is correlated with hs-CRP (P < 0.01, r = 0.6013). “(d)” HR is correlated with the levels of NE in LC (P < 0.01, r = 0.6106). “(e)” HR is correlated with the levels of DA in LC (P < 0.01, r = −0.5048). “(f)” cTn-T is correlated with the levels of NE in myocardial tissue (P < 0.01, r = 0.614). “(g)” cTn-T is correlated with the levels of DA in myocardial tissue (P < 0.01, r = −0.7359). “(h)” LDH is correlated with the levels of NE in myocardial tissue (P < 0.01, r = 0.6962). “(i)” LDH is correlated with the levels of DA in myocardial tissue (P < 0.01, r = −0.5199). “(j)” CK-MB is correlated with the levels of NE in myocardial tissue (P < 0.01, r = 0.5814). “(k)” CK-MB is correlated with the levels of DA in myocardial tissue (P < 0.01, r = −0.4678).
