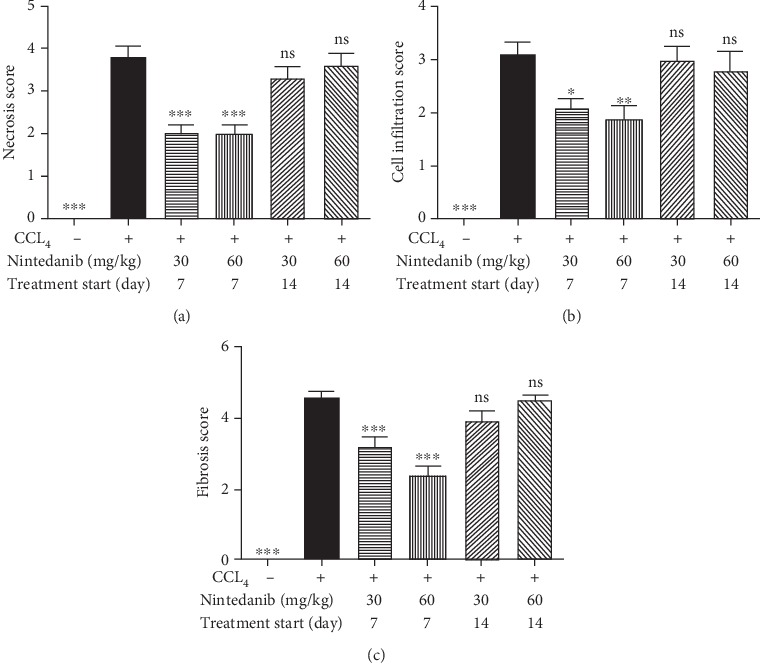
Figure 8.

Effect of nintedanib on (a) liver necrosis, (b) liver inflammatory cell infiltration, and (c) liver fibrosis score during the therapeutic phase. Data are presented as mean ± standard error of the mean; n = 5 per group. Statistical significance is shown as ∗p < 0.05, ∗∗p < 0.01, ∗∗∗p < 0.001. CCL4: carbon tetrachloride; ns: not significant.
