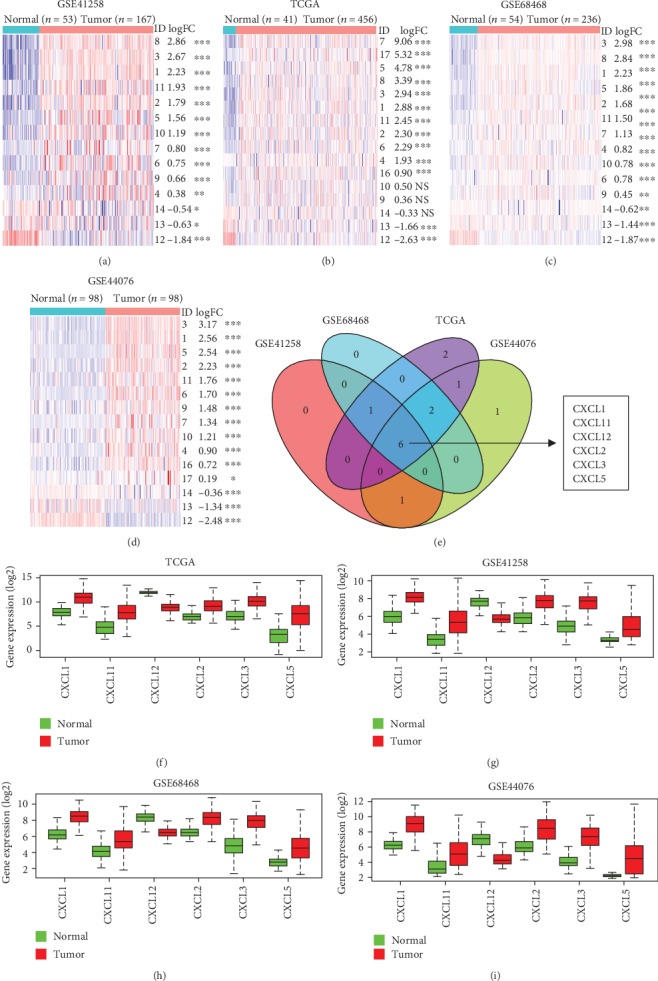
Figure 1.

Aberrant expression of CXCLs (CXCLs) in colon cancer. (a–d) Heat maps showing the expression differences in CXCLs between tumor and normal samples in the order of descending logFC based on GSE41258, TCGA, GSE68468, and GSE44076 datasets. The blue and red colors represent low and high expression, respectively. ∗∗∗P < 0.001; ∗∗P < 0.01; ∗P < 0.05; NSP > 0.05. CXCLs with P < 0.05, FDR < 0.05, and ∣logFC∣ > 1 were identified as DEGs. (e) Venn diagram displaying the overlapping DEGs in the aforementioned datasets, including CXCL1, CXCL11, CXCL12, CXCL2, CXCL3, and CXCL5. (f–i) Boxplots representing the different expression levels of the overlapping genes in tumor and normal samples according to TCGA, GSE41258, GSE68468, and GSE44076 datasets.
