Figure 9.

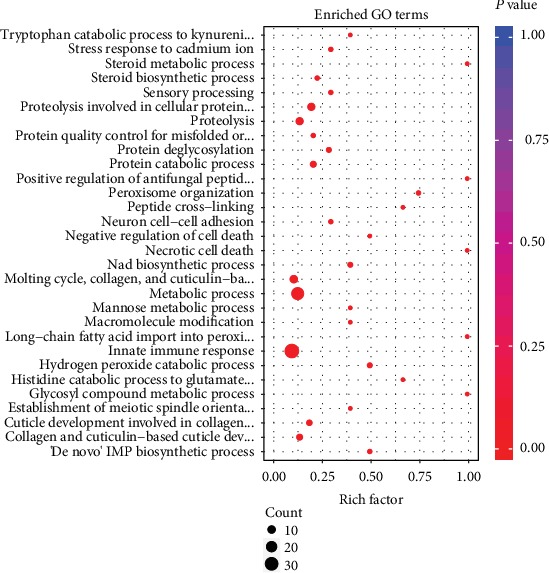
GO enrichment analysis of DEGs in the BP of the AT vs. CK and PR vs. AT (top 30). Count: the bubble size indicates the number of enriched DEGs. P value: significant level of enrichment; the redder the color, the higher the enrichment.

GO enrichment analysis of DEGs in the BP of the AT vs. CK and PR vs. AT (top 30). Count: the bubble size indicates the number of enriched DEGs. P value: significant level of enrichment; the redder the color, the higher the enrichment.