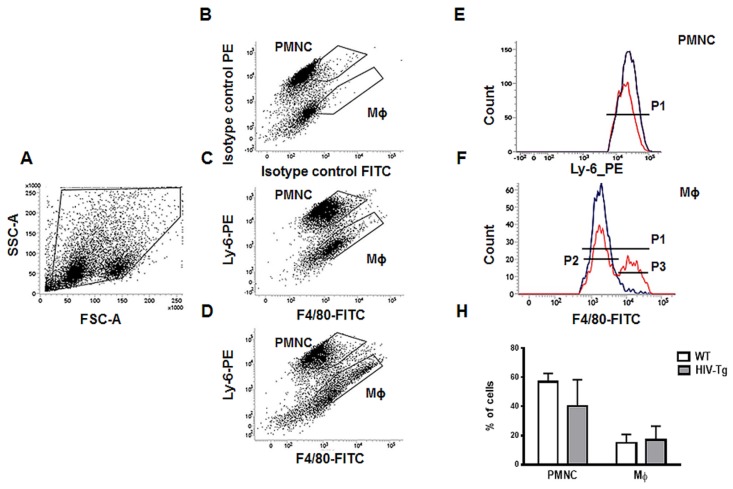
Figure 2.
Similar levels of peritoneal neutrophils and macrophages in HIV-Tg and WT mice 24 h after LPS injection (A) Forward scatter versus side scatter (FCS vs. SSC) plot represents all peritoneal cell populations and gating strategy. (B–D) Flow cytometry analysis of peritoneal lavage shows neutrophil (PMNC) and macrophage (Mϕ) subsets in isotype control (panel B), WT mice (panel C) and HIV-Tg mice (panel D). (E,F) representative flow cytometry data for PMNC (E) and Mϕs (F) for WT (blue color) and HIV-Tg (red color) mice. (H) Quantification of flow cytometry data for peritoneal PMNC and Mϕ for P1 gate (n = 5). P2 is a gate for Mϕ with low level F4/80, P3 is a gate for Mϕ with high level of F4/80. Results are shown as percent of cell population. Mean and standard error are shown.

