Figure 2.
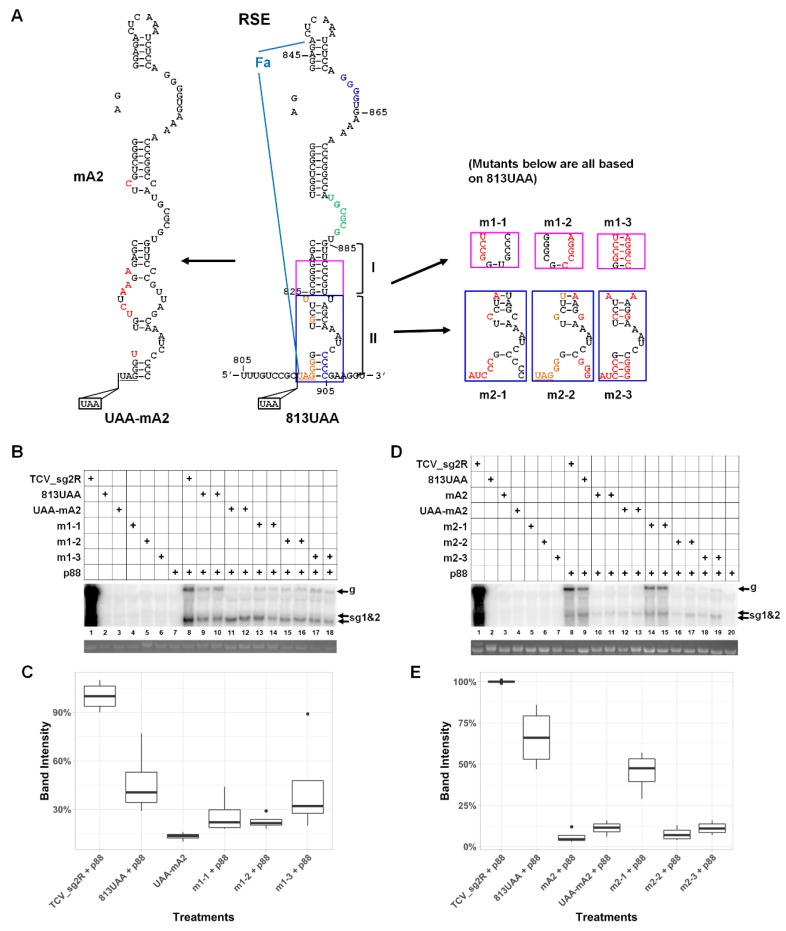
Role of the Fa and RSE in TCV gRNA accumulation. (A) Diagrams of all mutants tested in this set of experiments. The RSE secondary structure is shown in the middle. The boundaries of the Fa element are highlighted to the left with two blue lines. The seven highly conserved nts at the beginning of the element are in orange letters. The CCCC and GGGG stretches implicated in an intra-RSE pseudoknot are in bright blue letters. The six nts implicated in a long-distance interaction, UGCGCG, are in green letters. The lower half of the RSE, which was the main focus of the current study, is further divided in stems I and II, to simplify the narration. The pink and bright blue boxes highlight the sections being investigated with mutagenesis. Most of the mutants also contained the UAA insertion shown at the bottom. The left-side diagram shows all the nts mutated in the mA2 mutant. (B) Northern blotting revealed the impact of 813UAA, mA2, m1-1, m1-2, and m1-3 mutants on TCV gRNA levels. (C) Box plot quantification of Northern blotting results in (B), with multiple repeats. (D) Northern blotting revealed the impact of m2-1, m2-2, and m2-3 mutants on TCV gRNA levels. Note that the m2-1 mutant mutated all of the seven conserved nts and was expected to extensively perturb stem II. (E) Box plot quantification of Northern blotting results in (D), with multiple repeats.

