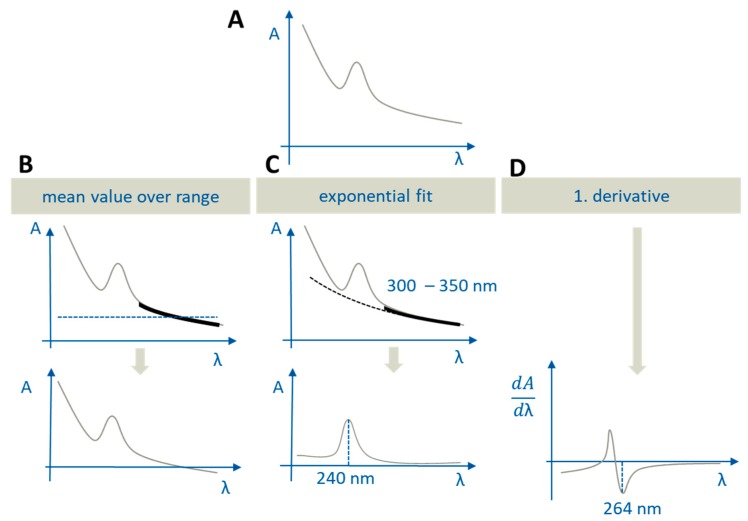
Figure 2.
Different options to correct scattering in UV-Vis spectra: (A) Uncorrected spectrum; (B) mean value over range, black bold range: Mean value calculation (at the top) and the corrected spectrum (at the bottom); (C) exponential fit, black bold range 300–350 nm: Fitting function range (at the top). Ritonavir is quantified at 240 nm using the corrected spectrum (at the bottom); (D) first derivative and the inflection point at 264 nm, where ritonavir is quantified (at the bottom).

