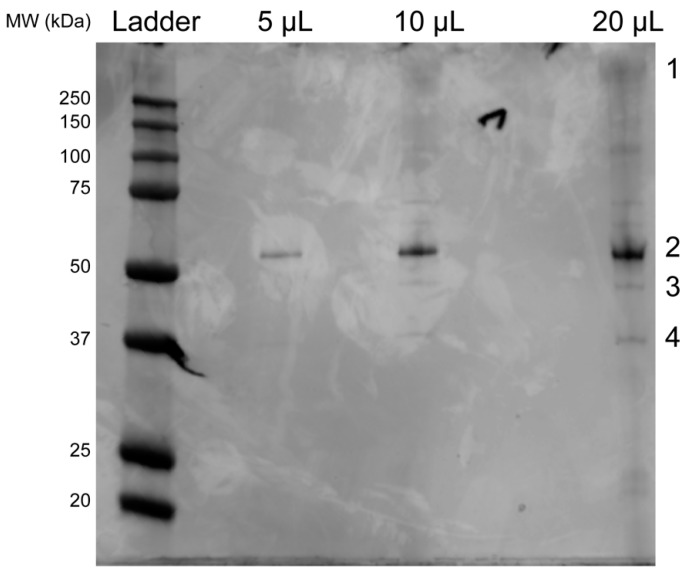
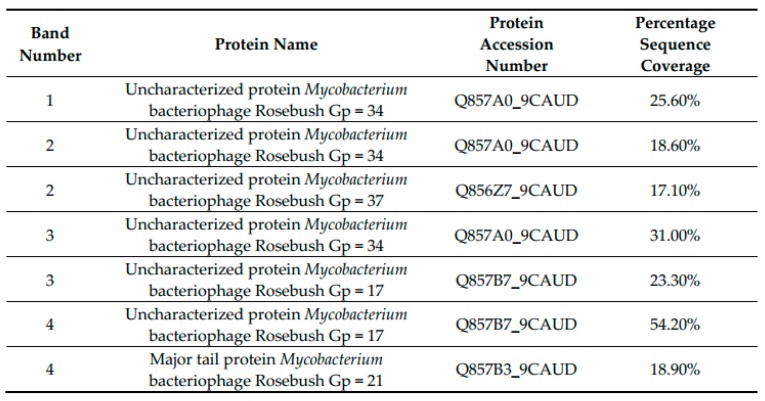
Figure 7.
Mass spectrometry identification of accessory proteins in Rosebush. SDS-PAGE gel of Rosebush (top) with the bands excised for mass spectrometry highlighted by 1–4. Bottom: the results of the mass spectrometry shown for each band highlighting the Rosebush proteins with at least 15% sequence coverage. Full mass spectrometry results can be found in Tables S1–S4.


