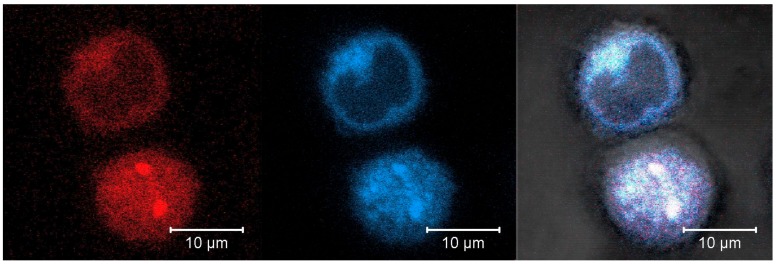
Figure 9.
Representative CLSM images in fluorescence, transmission and overlay modes of A549 cells after 24 h culturing with DOX-HSA-MPs (5000 particles/cell) and Lysotracker® Deep Red staining. Fluorescence modes was accessed with excitation at 488 nm and band pass emission filter 530/600 nm for DOX (red color) and excitation at 633 nm and long pass emission filter 650 nm for Lysotracker® Deep Red (blue color).

