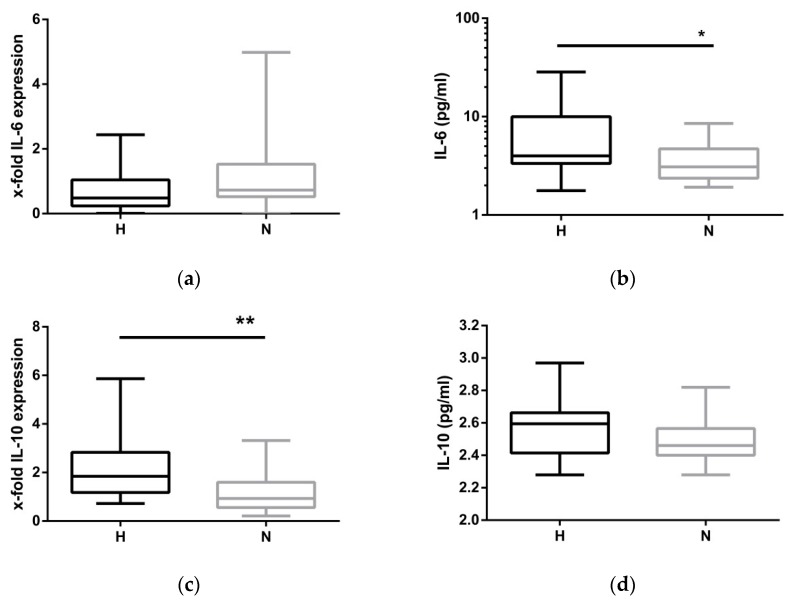
Figure 4.
IL-6 and IL-10 expression at BS2. (a,c) mRNA expression of IL-6 and IL-10 in hypervolemic (H) and normovolemic (N) patients; (b,d) Il-6 and IL-10 expression (pg/mL) in serum of hyper- and normovolemic patients. The data are presented as box blots depicting median as well as the 25th and 75th percentiles. Statistical analysis was performed using the Student’s t-test or the Mann–Whitney test for unpaired samples as appropriate. (* p < 0.05, ** p < 0.01).

