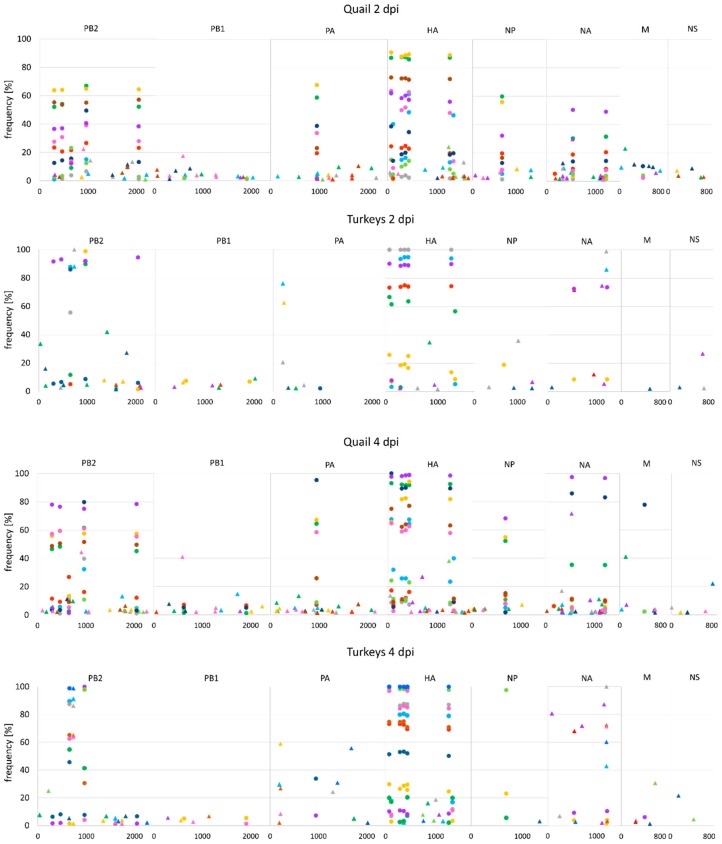
Figure 4.
Distribution and frequency of variants in the virus population in oropharyngeal swabs collected from turkeys and quail infected with H9N2 AIV. The x-axis represents the genomic positions for each genome segment. Variants present in the same samples are showed with the same colour. Circles – variants of inoculum origin, triangles – variants that emerged during infection.

