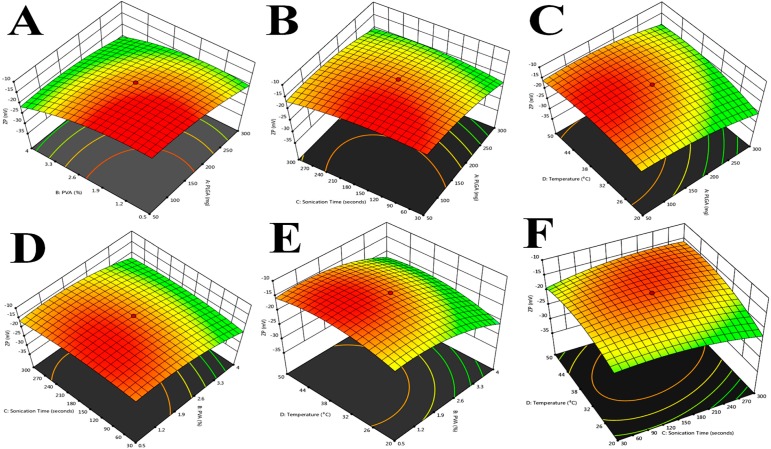
Figure 3.
Response surface plot showing the effect of independent variables on Zeta potential (ZP). (A). Zeta potential, PVA (%), PLGA; (B). Zeta potential, sonication time, PLGA; (C). Zeta potential, temperature (°C), PLGA; (D). Zeta potential, sonication time, PVA (%); (E). Zeta potential, temperature, PVA (%); (F). Zeta potential, temperature, sonication time.

