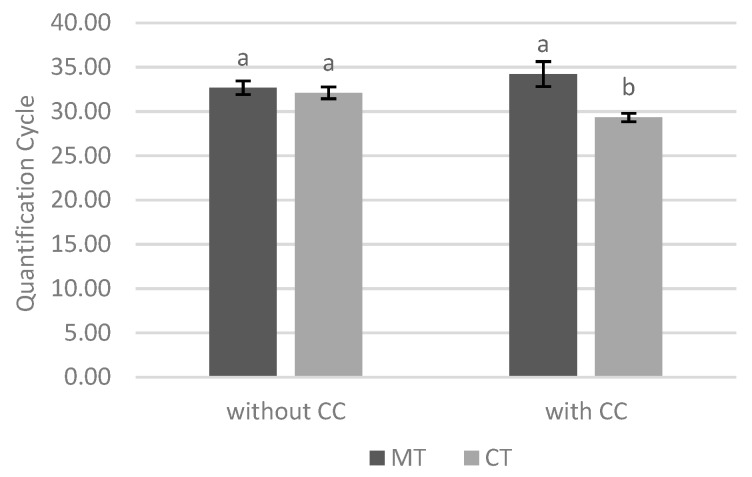
Figure 9.
Effect of interaction between soil cover and tillage system in quantification cycle values at date 1. Different lowercase letters indicate significant differences for p < 0.05. Vertical upper bars represent the standard error of the mean. Caption: MT—minimum tillage; CT—conventional tillage; CC—cover crop.

