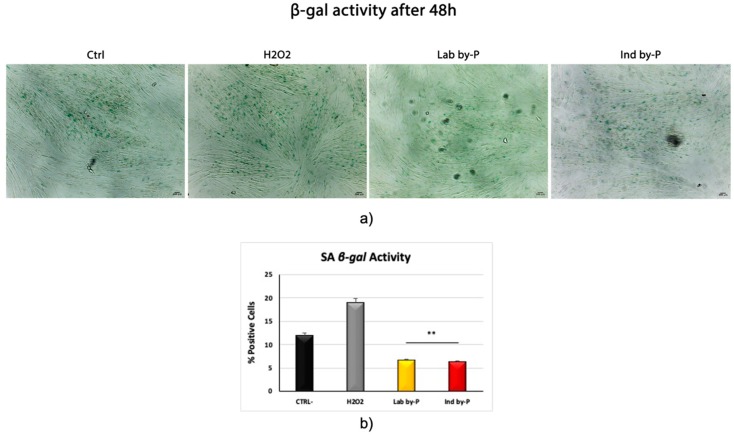
Figure 3.
Senescence-associated β-galactosidase activity. (a) β-galactosidase was evaluated in H2O2-senescent ADSCs treated with Lab by-P, or with Ind by-P, compared to control untreated ADSCs (Ctrl). Scale bar = 100 μm. (b) The numbers of positive (blue) and negative cells were counted under the light microscope and the percentage of SA-β-Gal-positive cells for each treatment was calculated as the number of positive cells divided by the total number of cells counted using an image software analysis (ImageJ). Data are expressed as mean ± SD referring to the control (* p ≤ 0.05; ** p ≤ 0.01).

