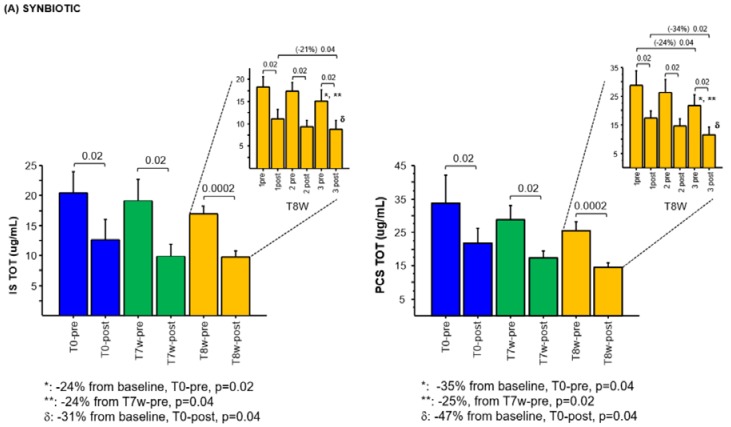
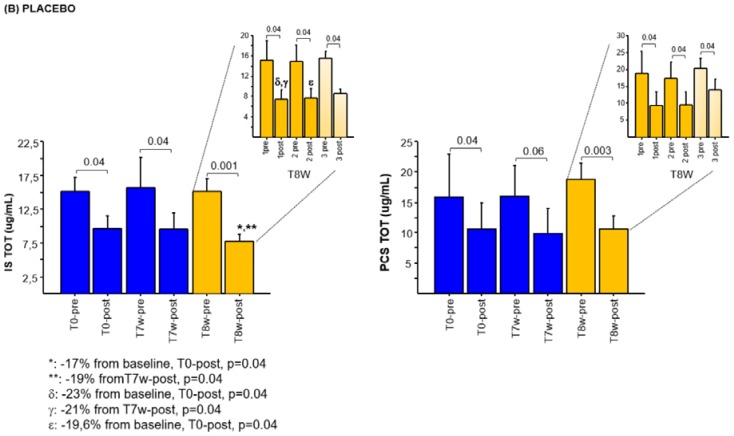
Figure 4.
Plasma concentrations of the total IS and PCS in the two groups (A Synbiotic and B Placebo) of dialysis patients: (A) at baseline (T0-pre/post-dialysis); after 7 weeks of synbiotic treatment (T7w-pre/post-dialysis); mean values before and after the three dialysis sessions with the DVB-cartridge with the synbiotic treatment at week 8 (T8w-pre/post-dialysis). At the top right of each chart, the values before and after each dialytic session carried out at week 8 are reported: first (1-pre/post), second (2- pre/post), and third (3-pre/post) dialysis session. (B) at baseline (T0-pre/post-dialysis); after 7 weeks of placebo treatment (T7w-pre/post-dialysis); mean values before and after the three dialysis sessions with DVB-cartridge with the placebo treatment at week 8 (T8w-pre/post-dialysis). At the top right of each chart, the values before and after each dialytic session carried out at week 8 are reported: first (1-pre/post), second (2-pre/post), and third (3-pre/post) dialysis session. Data are expressed as mean ± SE. (Wilcoxon test).


