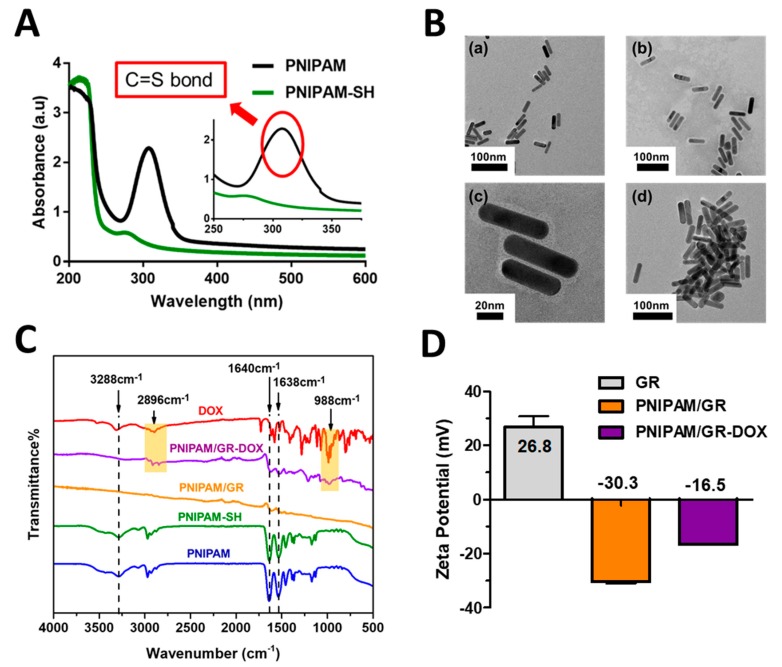
Figure 3.
Analytical confirmation of PNIPAM, PNIPAM-SH, PNIPAM/GR, PNIPAM/GR-DOX synthesis. (A) UV–vis absorption spectra of PNIPAM and PNIPAM-SH in DI water. (B) FE-TEM images of (a) GRs, (b) and (c) PNIPAM/GR, and (d) PNIPAM/GR aggregations after laser treatment. Scale bars indicate 100 μm in (a), (b), (d) and 50 μm in (c). (C) FT-IR spectra of PNIPAM, PNIPAM-SH, PNIPAM/GR, PNIPAM/GR-DOX, and free DOX (wavenumber 500–4000 cm−1. The yellow shaded area illustrates DOX binding. (D) Surface zeta potential of the synthesized GR-CTAB, PNIPAM/GR, and PNIPAM/GR-DOX dispersed in DI water.

