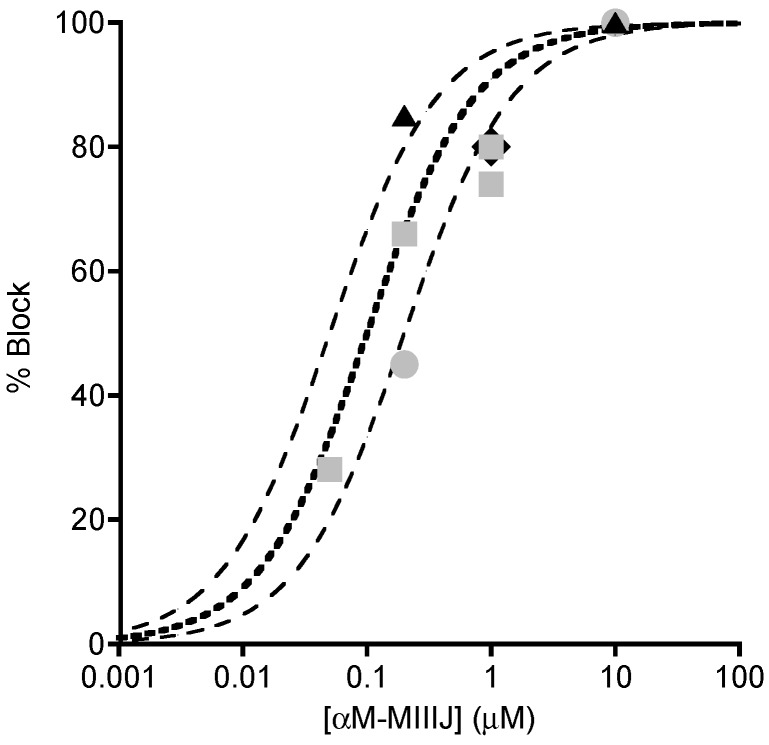
Figure 6.
Concentration-dependent block by αM-MIIIJ of synaptically- and ACh-evoked responses at frog and fish NMJs. Plot summarizing results with different concentrations of αM-MIIIJ from experiments of the sort illustrated in Figure 4; Figure 5. Percentage block of: EPSPs in X. laevis LP (circles, 2); spontaneous MEPSPs in X. laevis LP (squares, 4) and goldfish IC (diamond, which denotes the minimum block of 80% by 1 μM peptide in fibers D, E, and F in Figure 5); and ACh-evoked responses in X. laevis LP (triangles, 2). Each point represents one measurement. Block of EPSPs were not corrected for non-linear summation [24] and are therefore minimum estimates. Lines are curves of the Langmuir adsorption isotherm, % Block = 100%/{1 + (IC50/[Toxin])}, where [Toxin] is αM-MIIIJ concentration, and IC50 = 0.1, 0.05 or 0.2 μM (central bold-dotted line and flanking dashed lines, respectively). Experimental points lie close to or between the dashed lines and suggest an aggregate IC50 within a factor of about two of 0.1 μM.

