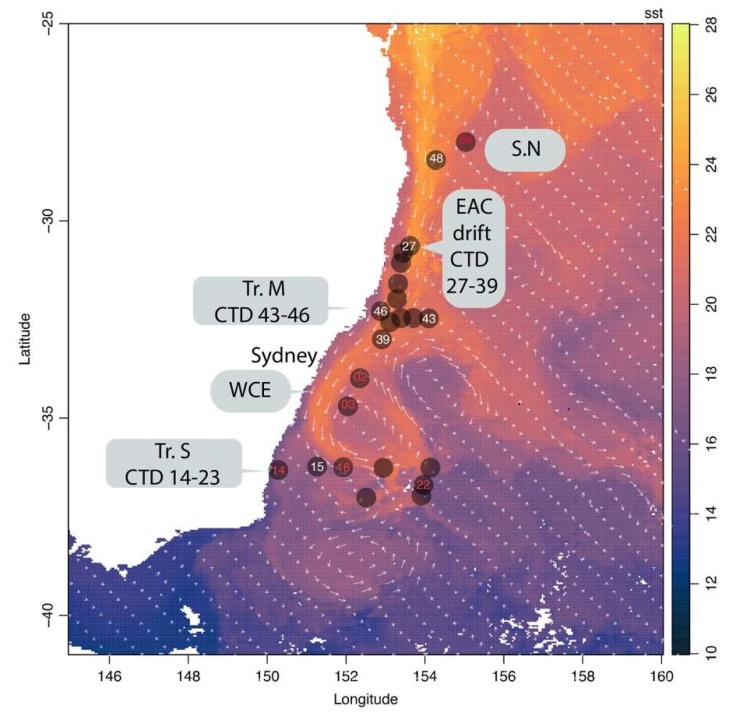
Figure 1.
Location of the sampling sites along the east coast of Australia: Transect South (Tr.S), Transect middle (Tr.M), the Lagrangian drift along the EAC (EAC drift), the northern samples (SN) and the samples collected inside a warm core eddy (WCE). Data for the 8-day composite average surface seawater temperature on a 4 km resolution were obtained from the Australian Ocean Data Network portal (https://portal.aodn.org.au/) for the period September 2016. Sampling sites and transects are highlighted. Colours of the CTD deployments are related to the availability of metagenomes for either the microbial fraction (white) (>0.2 µm) or the microbial (>0.2 µm) and viral fraction (<0.2 µm) (red).

