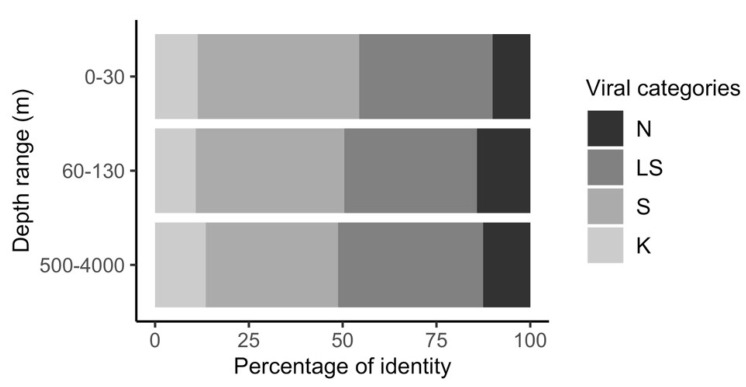
Figure 2.
Depth distribution of novel and known bacteriophage contigs. Similarity to previously sequenced viromes and metagenomes was assigned with a BLASTn analysis against the IMG/VR database (2018) using a similarity cut-off of >60% genes with >70% nucleotide identity. Similarity categories: N (novel: shared < 20% genes), LS (low similarity: share > 20% and < 60% genes), S (similar: share >60% and < 80% genes), K (known phage: share > 80% of the genes). Contig abundance was normalized based on read counts.

