Figure 1.
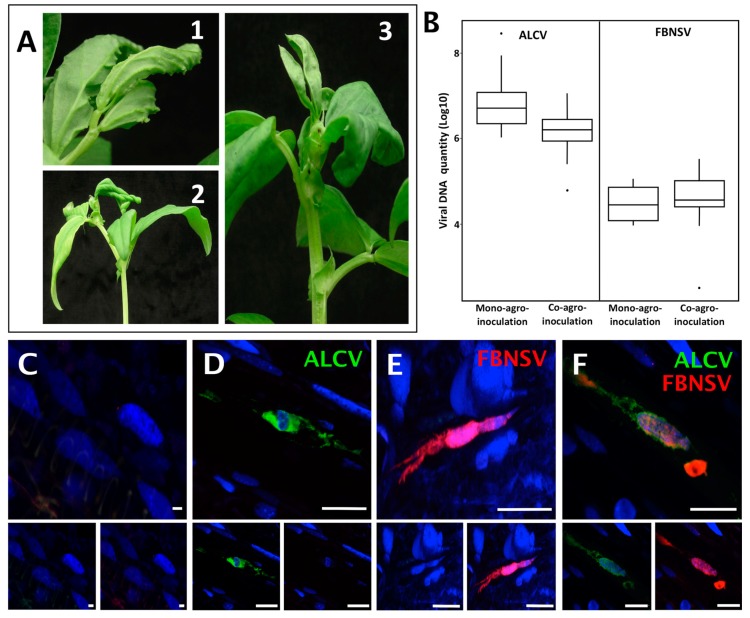
Localization of FBNSV and ALCV DNA in broad bean host plants. Visualization of ALCV symptoms (A1) and FBNSV symptoms (A2) on late stage of infection on broad bean plants, where symptoms are easier to see, and ALCV + FBNSV symptoms (A3) on early stage of infection, when over-curling of leaves due to FBNSV do not yet totally mask ALCV-associated vein swelling. (B) Box-plots of viral DNA amounts (log10 of the copy number, see Materials and Methods) of each virus in mono- and co-agro-inoculated broad bean plants. The box-plot on the mono- and co-infected plants represent n = 9 for FBNSV, n = 11 for ALCV and n = 15 for co-infected plants, respectively. C to F: Localization of ALCV DNA (green probe) and FBNSV DNA (8 segments labeled, red probe) in phloem tissues of broad bean plants either mock infected (C), or co-infected with the two viruses (D–F). Most cells contain either ALCV (D) or FBNSV (E) alone, but they can also occasionally be co-infected (F). Top panel in C to D are images with merged color channels and the corresponding split channels are at the bottom left (green) and right (red). Each image corresponds to maximum intensity projections. The scale bar of each image represents 25 µm. Cell nuclei are DAPI blue-stained.

