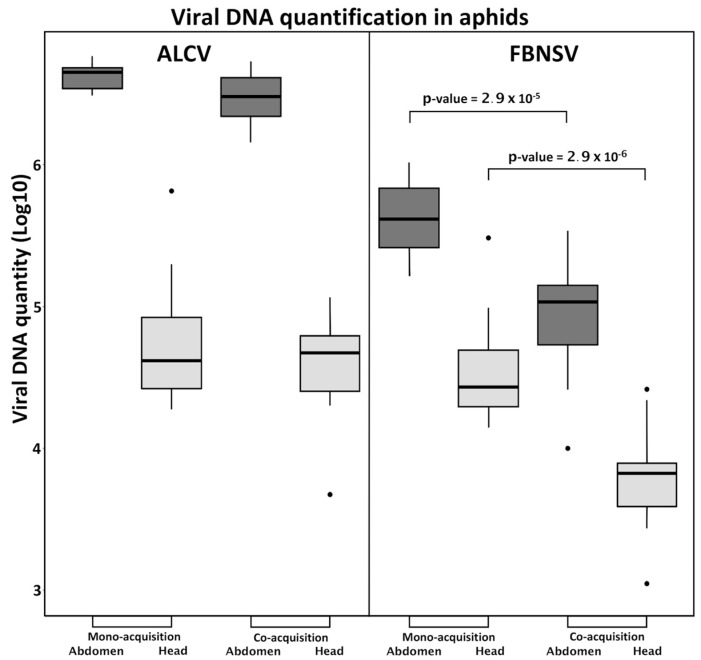
Figure 2.
Accumulation of FBNSV and ALCV in aphid vectors. The box-plots represent the amounts of viral DNA (log10 of copy number) of ALCV and FBNSV in the abdomens (dark grey) and heads (light grey) of A. craccivora. The box-plots are from pools of five abdomens or heads with n = 11 for monoinfection and n = 15 for coinfection. p-values given result from testing the differences in FBNSV DNA amounts in heads or abdomens of aphids that have acquired FBNSV from mono-infected versus co-infected plants.

