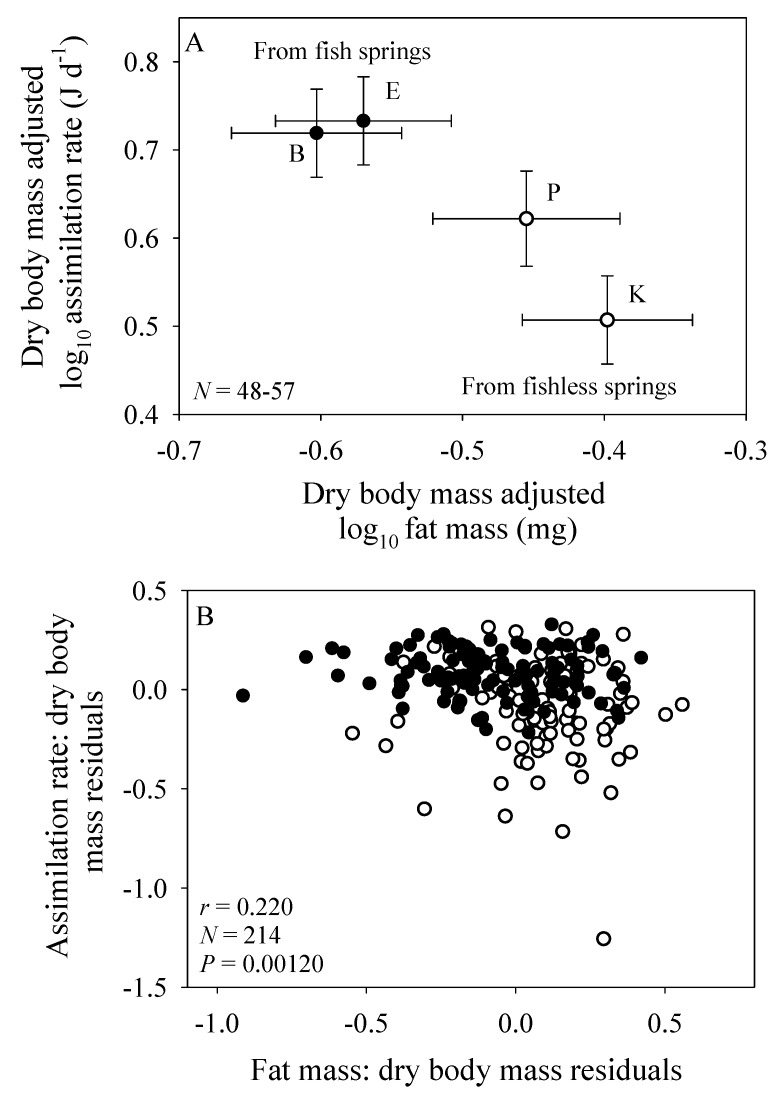
Figure 2.
Assimilation rate as a function of fat mass in four populations of the amphipod Gammarus minus, two from springs with fish (solid circles) and two from springs without fish (open circles) (based on data in Supplementary Materials). (A) Shown are mean values (± 95% confidence intervals) adjusted to dry body mass by ANCOVA for each population and the range of sample sizes (N) among all four populations. (B) Shown are individual values expressed as residuals from least squares regressions against dry body mass for all four populations collectively. Shown are the correlation coefficient (r), sample size (N) and probability that the correlation between the residuals of assimilation rate and fat mass is due to chance (P).

