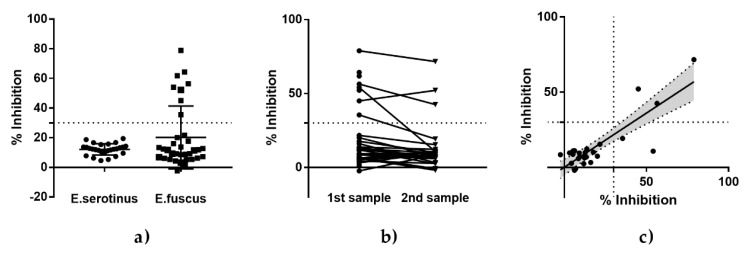
Figure 3.
ELISA results (% inhibition) for sera from Eptesicus serotinus and Eptesicus fuscus taken prior to experimental studies. The threshold of 30% inhibition as a cut-off for seropositivity is indicated as a dashed line. (a) ELISA results for all sera tested stratified by species. For Eptesicus fuscus, serum was taken at two occasions prior to infection. The comparative results between sampling point one and two are presented on an individual level (b) and were analyzed by a linear regression model (c). The slope (solid line) and the 95% CI (gray zone) are indicated. The results for the second sampling can be calculated using the formula Y = 0.7205X + 0.07097, with a slope that is highly significant divergent from zero (p < 0,0001).

