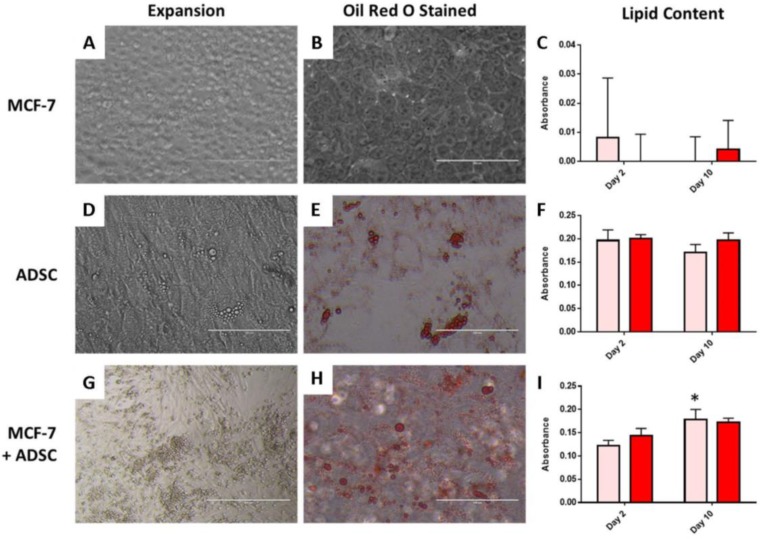
Figure 5.
Expansion of (A) MCF-7 cells, (D) ADSCs and (G) MCF-7 and ADSCs co-cultured after 10 days in 2D culture. (B,E,H) show representative images of cells stained with Oil Red O to detect intracellular lipid produced following culture in adipogenic maintenance medium. The lipid content with respective absorbance values for each condition are shown in (C,F,I). Scale bar = 400 µm.

