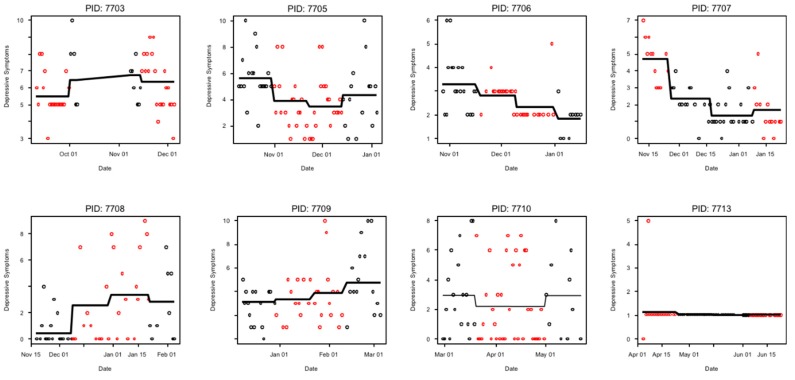
Figure A2.
Individual patient-level plots of depressive symptoms over the course of each personalized trial for eight patients who completed the 12-week protocol. Black dots refer to bright white light therapy treatment periods, and red dots refer to dim red light therapy treatment periods. Symptoms were reported at the end of the day using a 0 (no depressive symptoms) to 10 (severe depressive symptoms) visual analog scale.

