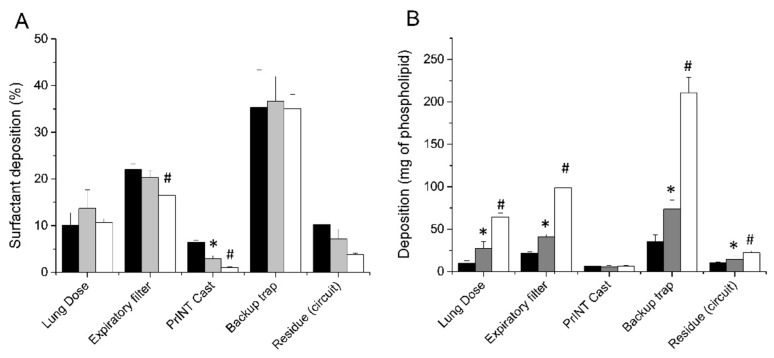
Figure 3.
(A) Mean cumulative percentage of deposited surfactant within different set-up compartments after delivering surfactant doses of 100 mg/kg (black bars), 200 mg/kg (grey bars), and 600 mg/kg (white bars). (B) Mean surfactant mass deposited within the different set-up compartments after delivering surfactant doses of 100 mg/kg (black bars), 200 mg/kg (grey bars), and 600 mg/kg (white bars). * P vs. 100 mg/kg dose < 0.01. # P vs. 200 mg/kg dose < 0.01.

