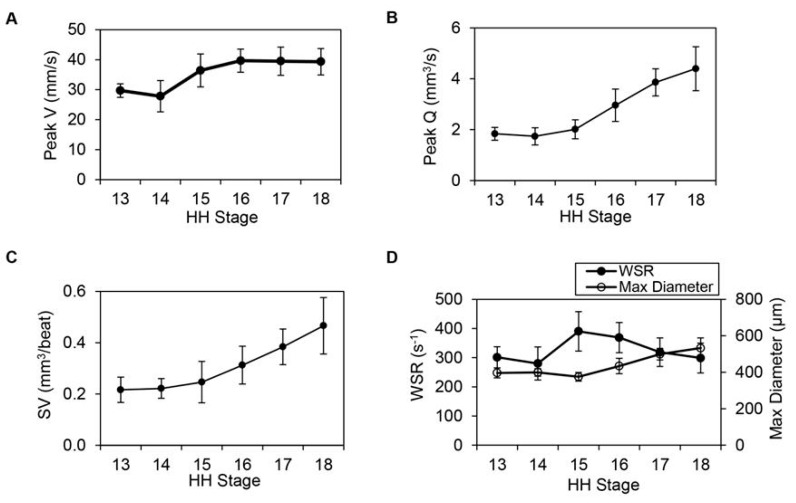
Figure 4.
Hemodynamic data elucidating cardiac function during looping stages, from HH13 to HH18 (n = 10 at each stage). (A) Peak centerline velocity (mm/s), (B) peak volume flow rate, Q (mm3/s), (C) stroke volume, SV (mm3/beat) and (D) wall shear rate, WSR (s−1) with maximum diameter (mm) displayed on the secondary y-axis. Average measures are shown at each stage together with standard deviations. Reproduced with permission from [173].

