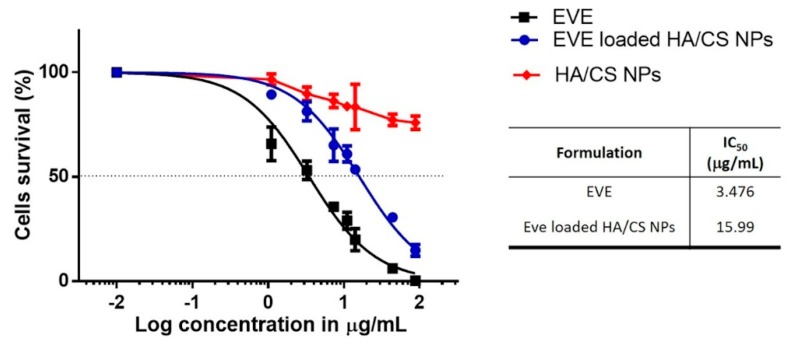
Figure 5.
Cytotoxicity results obtained by incubating hMSCs with EVE loaded HA/CS NPs, HA/CS NPs and free EVE. The graph shows the cell viability curves for the experimental conditions fitted with a sigmoidal dose-response curve. The resulting IC50 values are shown in the table. Results were expressed as mean ± SD.

