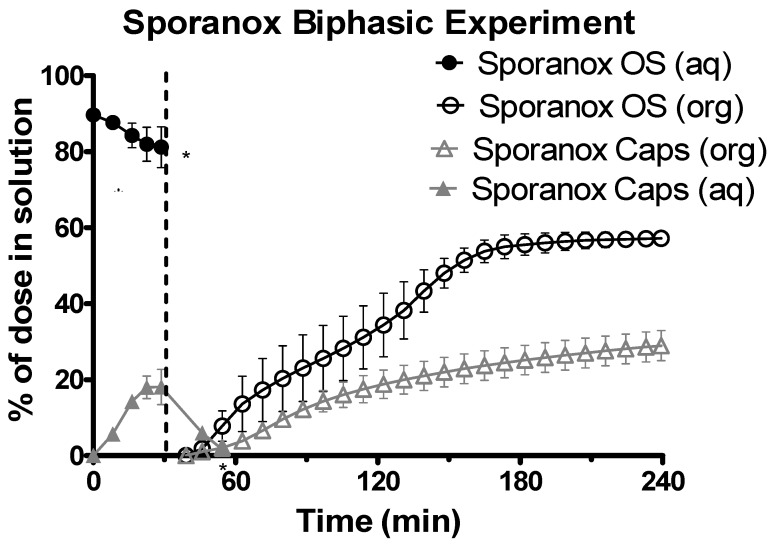
Figure 6.
Drug release time profile for Sporanox® formulations, dose equivalent to 5 mg API. Sporanox® OS and Sporanox® Capsules are represented by black circles and grey triangles respectively. Aqueous layer release is represented by filled points. Organic layer data are represented by the hollowed points. Dotted line indicates transition from gastric sector to intestinal sector. Each data point represents the mean ± SD (n = 3). * indicates where UV blackout occurred in the aqueous phase due to precipitation and/or limitations of quantification. aq = aqueous layer. org = organic layer.

