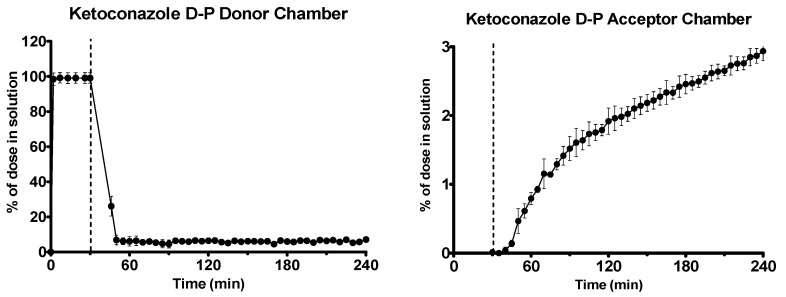
Figure 8.
Drug release time profile for the ketoconazole dose equivalent to 10 mg API using the D-P apparatus. Left: Percentage release profile in the donor chamber. Right: Percentage release profile in the acceptor chamber. Dotted line indicates transition from gastric sector to intestinal sector. Each data point represents the mean ± SD (n = 3).

