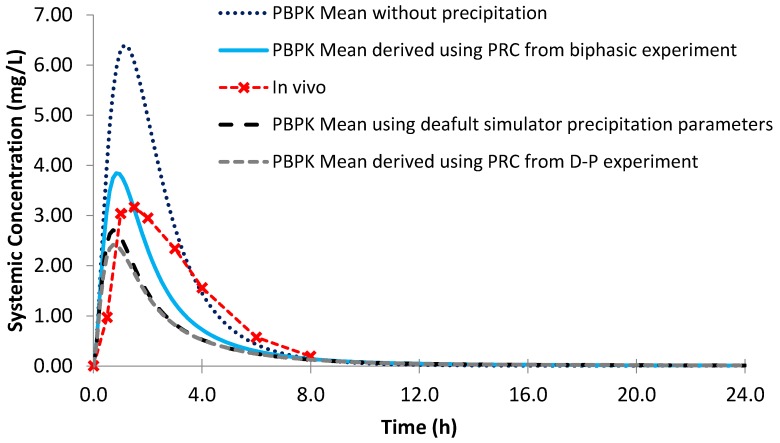
Figure 11.
Simulated plasma profile vs. in vivo plasma profile (dashed line with crosses) of ketoconazole after a single oral dose of ketoconazole 200 mg, based on the design of the clinical study by Daneshmend et al. [23]. The in vivo plasma profile is represented by the red dashed line with crosses. The simulated plasma profile derived from the biphasic dissolution data, the D-P data, the PBPK default simulator parameters and the profile without precipitation are represented by the solid blue line, the dashed grey line, the dashed black line and dotted dark blue line, respectively.

