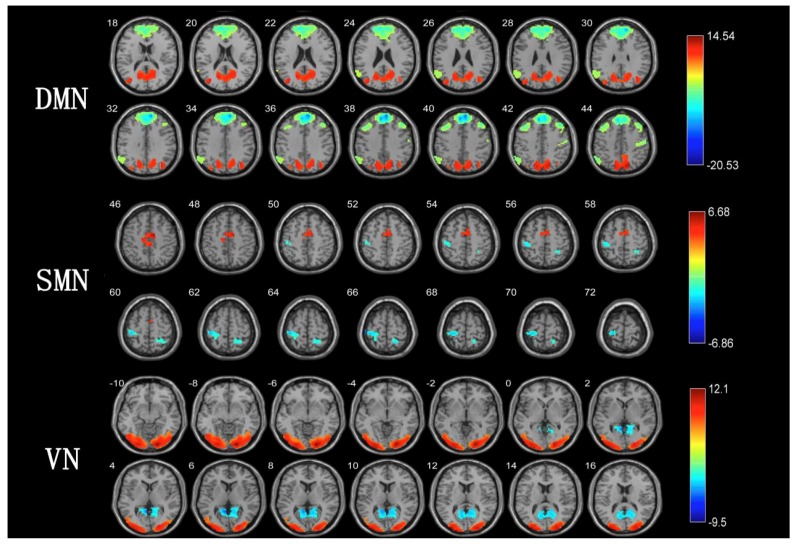
Figure 2.
Different results of brain network between TCC group and walking group. Note: Figure 2 is the different results of brain network between TCC group and walking group. Red represents the brain area of the TCC group greater than that of the walking group, blue represents the brain area of the walking group greater than that of the TCC group, and the color bar on the right represents the t-value. p < 0.05, voxel number >20. The results DMN (default mode network), SMN (sensory-motor network), and VN (visual network) were corrected by family-wise error.

