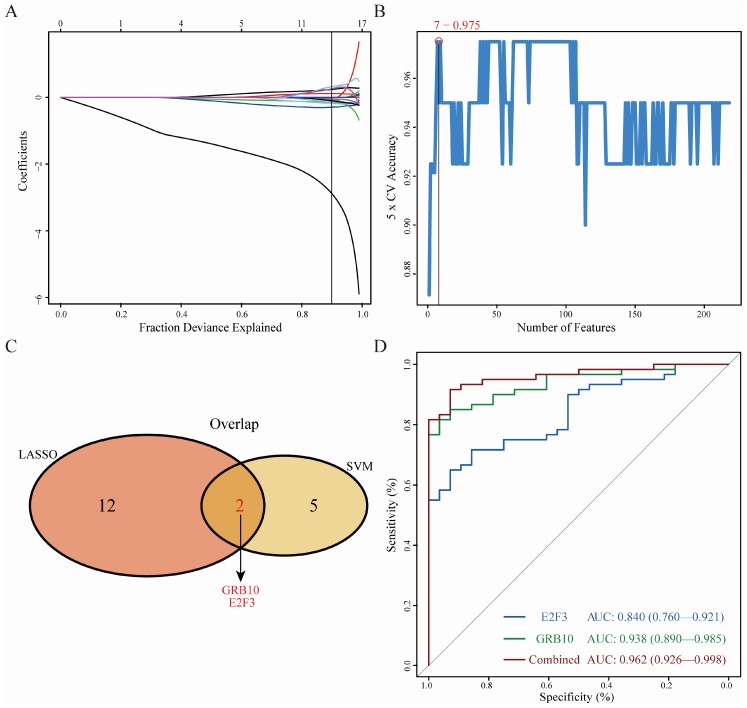
Figure 5.
Screening and verification of diagnostic markers. (A) Least absolute shrinkage and selection operator (LASSO) logistic regression algorithm to screen diagnostic markers. Different colors represent different genes. (B) Support vector machine-recursive feature elimination (SVM-RFE) algorithm to screen diagnostic markers. (C) Venn diagram shows the intersection of diagnostic markers obtained by the two algorithms. (D) The ROC curve of the diagnostic efficacy verification after fitting two diagnostic markers to one variable.

