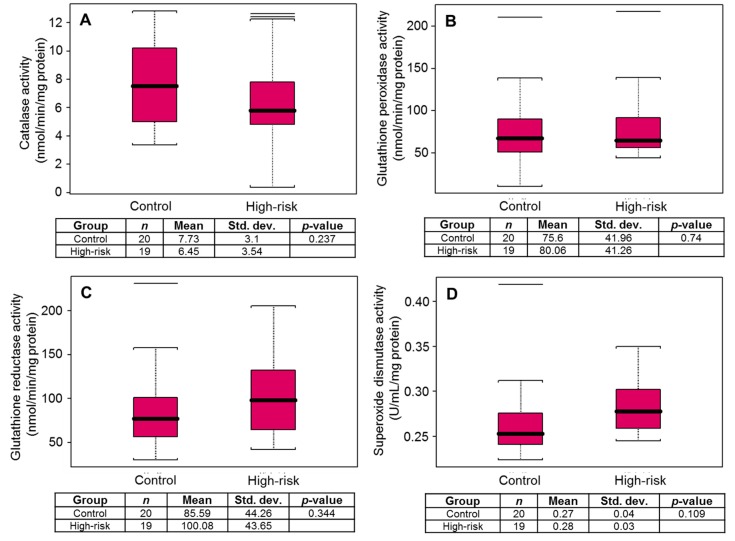
Figure 3.
Box plot for (A) catalase, (B) glutathione peroxidase, (C) glutathione reductase, and (D) superoxide dismutase activity in healthy controls and high-risk subjects for prostate cancer. Black bar = median, red box = 25th to 75th percentiles, Bars = entire range. The horizontal lines beyond the bars are outliers or whiskers are drawn individually.

