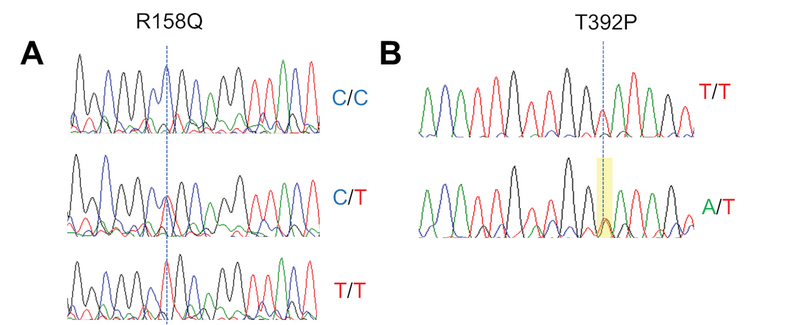
Figure 1.

Electropherograms showing R158Q (c.773 C T) (A) and T392P (c.1474T A) (B) variants. Genotypes are indicated, and dotted vertical lines indicate peak location for each alteration. Sequencing of T392P variant was obtained using reverse primer.
