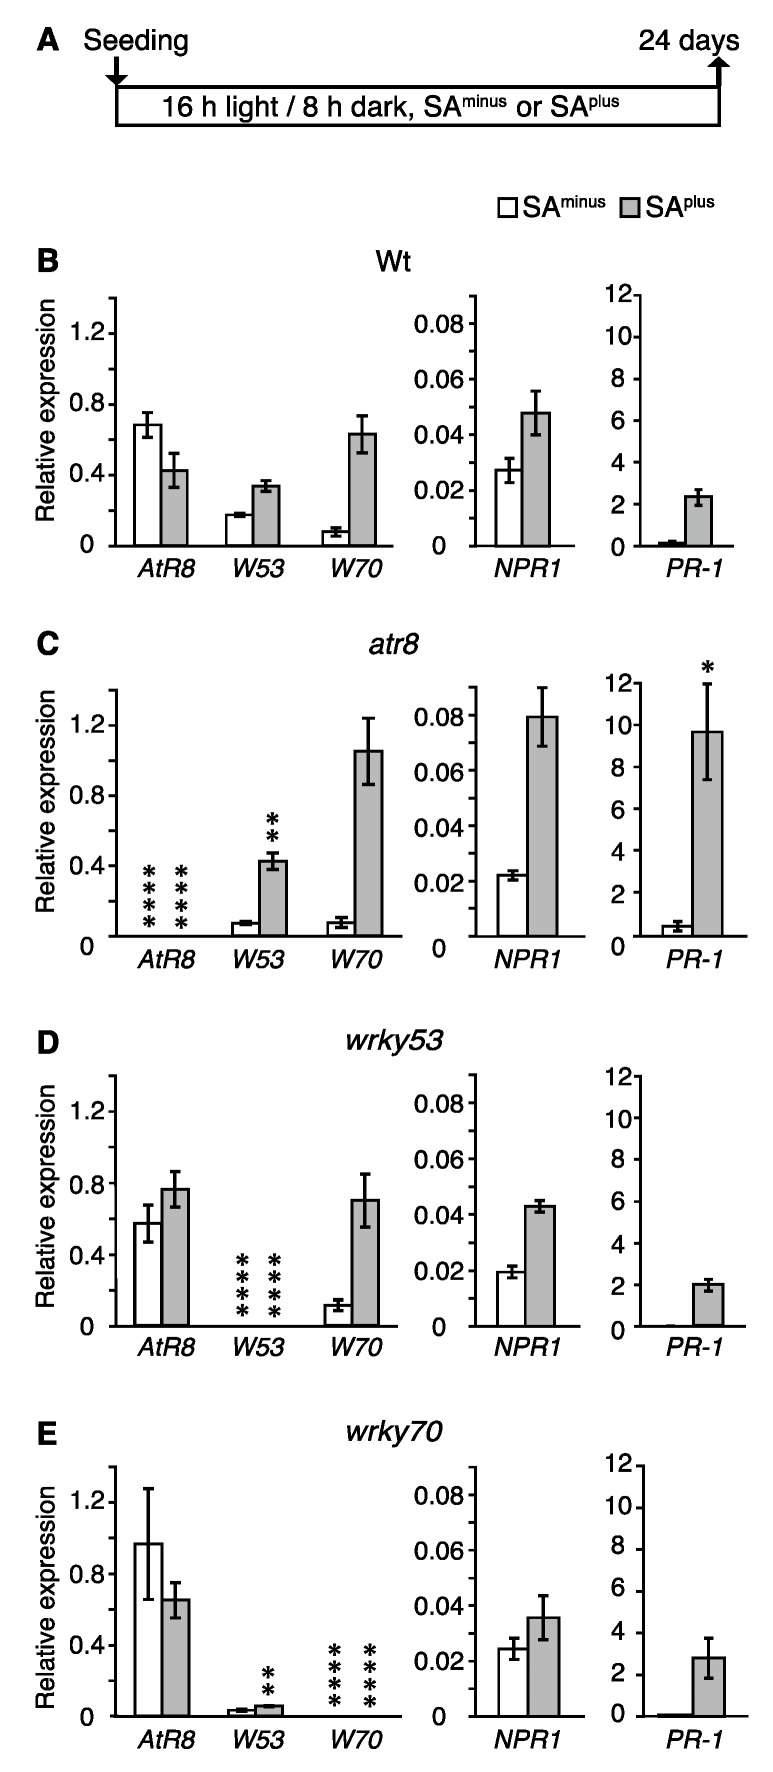
Figure 4.
Accumulation levels of RNAs in Arabidopsis under continuous treatment with 20 µM SA. (A) Timeline of experimental procedure. Up arrow indicates sampling. The total RNAs were extracted from the same seedlings shown in Supplemental Figure S2 (24 days after seeding). (B–E) The mRNA accumulation levels SAminus or SAplus were compared by RT-qPCR with ACT2 and ACT8 genes as standards. Bar graphs represent mean values of three independent assays (≥50 plants), and error bars represent ±SE. W53: WRKY53, W70: WRKY70. Significant differences in RNA accumulation levels between Wt (B) and each of the mutants (C–E) are indicated as * p < 0.05, ** p < 0.01 and **** p < 0.0001 (Welch´s t-test).

