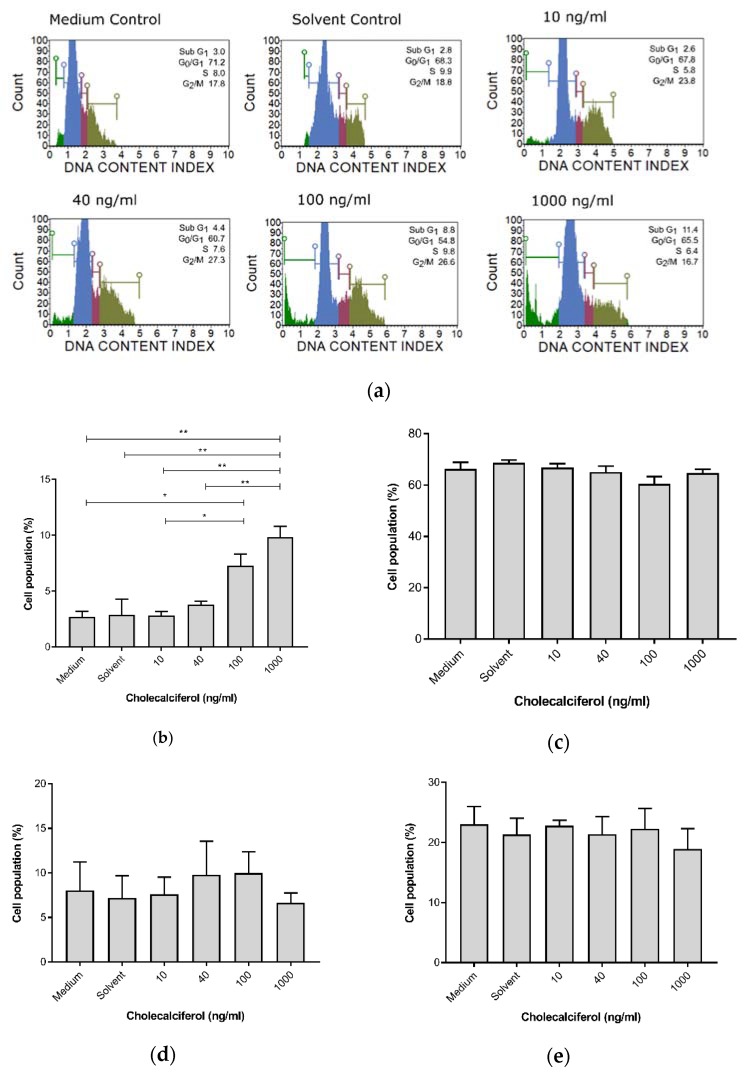
Figure 3.
Cell cycle analysis of DNA content by the Muse™ Cell Cycle assay in the CaSki, control, and experimental cultures. (a) DNA distribution histogram of the CaSki, control, and experimental cultures at different phases of the cell cycle. (b) Cells in the sub-G1 phase, (c) G1/G0 phase, (d) S phase, and (e) G2/M phase. Cholecalciferol treatment significantly increased the sub-G1 phases at the 100 and 1000 ng/mL treatments in comparison to the low-dose treatments and control cultures. Values are expressed as mean ± SEM (p < 0.05 was considered statistically significant). * p < 0.05; ** p < 0.01.

