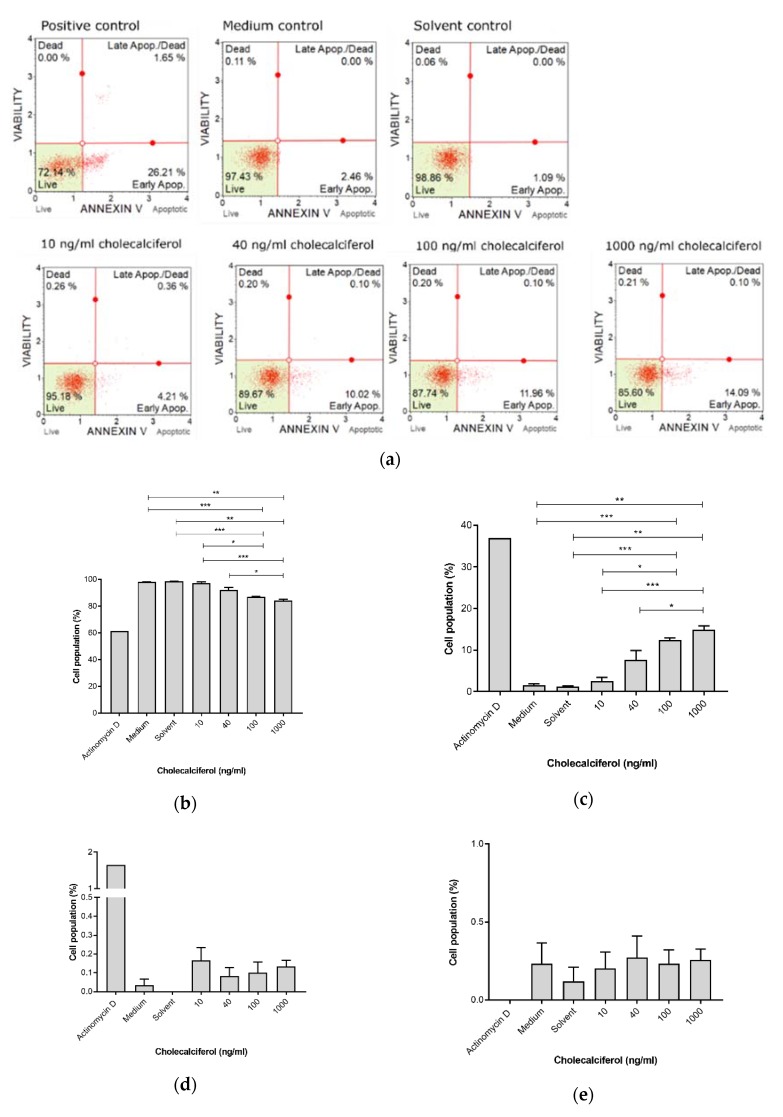
Figure 4.
Early biochemical apoptosis in the control and experimental CaSki cultures, using the Muse™ Annexin V assay. (a) Two-dimensional dot-plot diagrams, and cell populations. (b) Live cells. (c) Cells in early apoptosis. (d) Cells in late apoptosis and (e) dead cells. Cholecalciferol significantly decreased the live cell population and increased the proportion of cells in early apoptosis at 100 and 1000 ng/mL in comparison to the low-dose treatments and control cultures. Assays were performed on three biological replicates, and each replicate was technically triplicated. Values are expressed as mean ± SEM (p < 0.05 was considered statistically significant). * p < 0.05; ** p < 0.01; *** p < 0.001.

