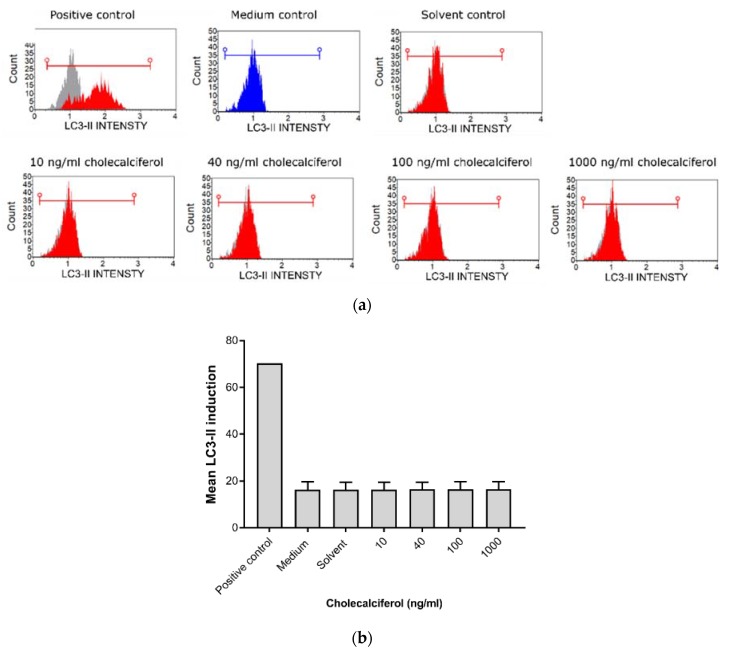
Figure 6.
Analysis of autophagic cell death by the Muse™ LC3-II detection assay. (a) Histogram of LC3-II intensity in the control and experimental CaSki cultures. (b) Statistical analyses of the LC3-II induction assays in the control and experimental CaSki cultures. Cholecalciferol treatments did not cause significant changes in LC3-II expression between the control and experimental cultures. Experiments were performed in triplicate with three biological repeats. Values are expressed as mean ± SEM (p < 0.05 was considered statistically significant).

