Figure 9.
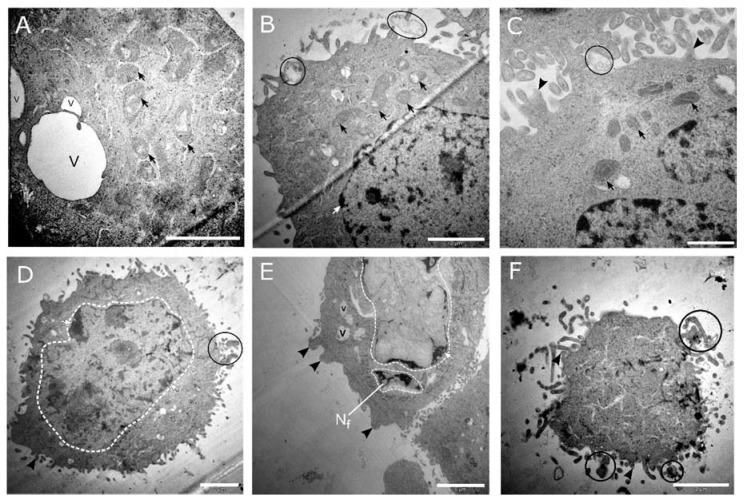
Transmission electron micrographs of CaSki cell cultures treated with 100 and 1000 ng/mL cholecalciferol. The micrographs (A–C) represent cultures treated with 100 ng/mL cholecalciferol, displaying mitochondria with dilated cristae (black arrows), apoptotic bodies (encircled in black), cell membrane blebbing (black arrowhead), and isolated vacuoles (v). Micrographs (D–F) represent cultures treated with 1000 ng/mL cholecalciferol, which show features of nuclear apoptosis, including nuclear fragmentation (Nf) and various stages of karyolysis (encircled white dashed line), membrane budding (black arrowheads), isolated vacuoles (v), and the presence of apoptotic bodies (encircled in black). (F) Terminal apoptotic events, demonstrating a shrunken cell with an amorphous cytoplasm surrounded by multiple apoptotic bodies (encircled in black). Scale bars: (A,B,D,F) = 2 µm and (C) = 1 µm.

