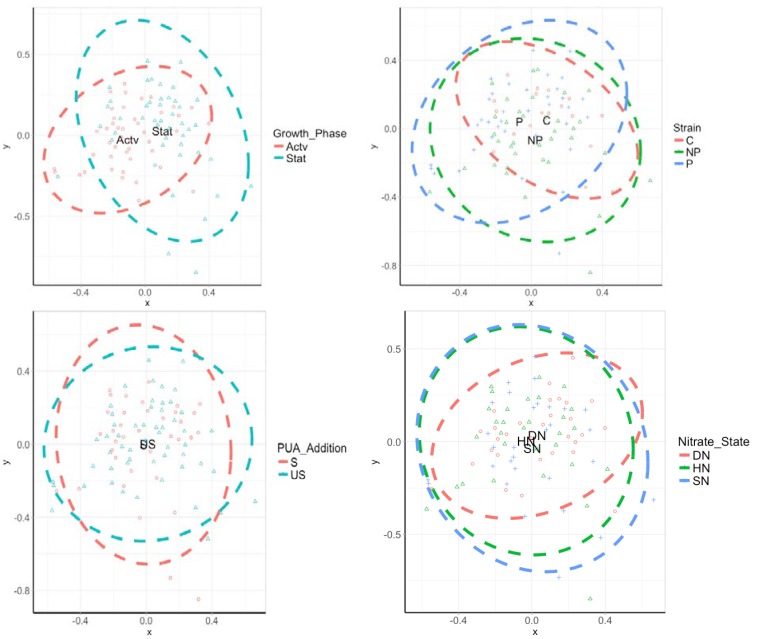
Figure 5.
Two-dimensional non-metric multi-dimensional scaling plot (NMDS) of a Bray–Curtis dissimilarity matrix for OTU-level taxonomic data. Each point symbolises a cultured sample. Clustered points show high similarity. Dashed lines show 95% confident limits and the letters show the centre of the community. Sample key: Actv = Active growth phase; Stat = Stationary growth phase; NP = Non-PUA-producing strain; P = PUA-producing strain; SN = Standard nitrogen relative to f/2 medium (8.82 × 10⁻⁴ M); HN = Halved nitrogen (4.41 × 10⁻⁴ M); DN = Double nitrogen (17.64 × 10⁻⁴ M); S = PUA spiked; US = Unspiked.

