Figure 3.
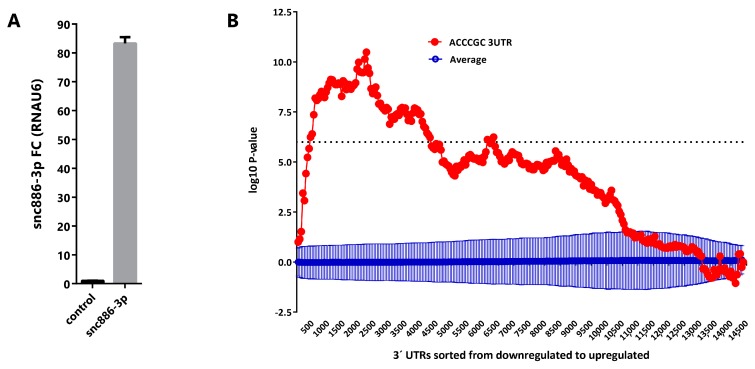
Snc886-3p downregulates transcripts bearing a 5′ACCCGC3′ sequence complementary to its putative seed in their 3′-UTR. (A) Expression of snc886-3p in DU145 cells transfected with 20nM of mimic snc886-3p and negative control (Dharmacon) after 48 h. Quantification by qRT-PCR using RNAU6 as a normalizer. (B) Sylamer enrichment landscape plot for 6-nt k-mer in all genes ranked by their change in abundance after snc886-3p overexpression compared to control determined by Affymetrix microarrays. The x-axis represents the sorted gene list (downregulated and upregulated genes are plotted in the left and right part of the axis respectively). The y-axis shows the hypergeometric significance for each 6-nt k-mer at each leading bin. Positive and negative values indicate enrichment or depletion of the 6-nt k-mer sequence at the 3′-UTR of the genes. The dotted horizontal line symbolizes an E-value threshold of 0.01 (Bonferroni corrected). The red line embodies the values obtained for the 6-nt k-mer (5′ACCCGC3′) complementary to the 6-nt seed (6-mer, 2-7-nt) of snc886-3p. The blue line shows the average profile of 6-nt k-mer unrelated to the seed region of snc886-3p (dark blue), with standard deviation as vertical bars.

