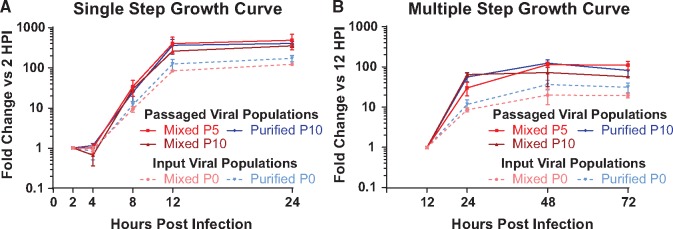
Figure 8.
Passaged virus populations replicate more than input viral populations. Viral populations from the indicated passages of the Mixed or Purified stocks were used to infect Vero cells in (A) a single step growth curve (MOI = 10), or in (B) a multiple step growth curve (MOI = 0.01). Each assay was done in triplicate, with viral harvest and quantification by titering at the indicated timepoints. Data are plotted as titer compared to the first time-point for each experiment (2 h for A, 12 h for B). Error bars indicate standard deviation. In both growth curves, comparisons of passaged viral populations versus the input viral populations were significantly different at the final two time-points (two-way ANOVA, P < 0.05).

