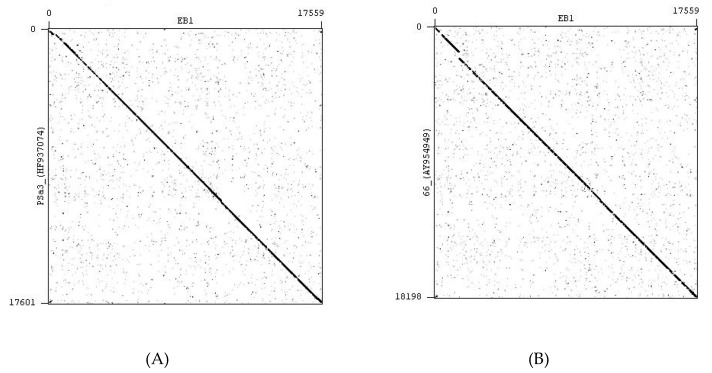
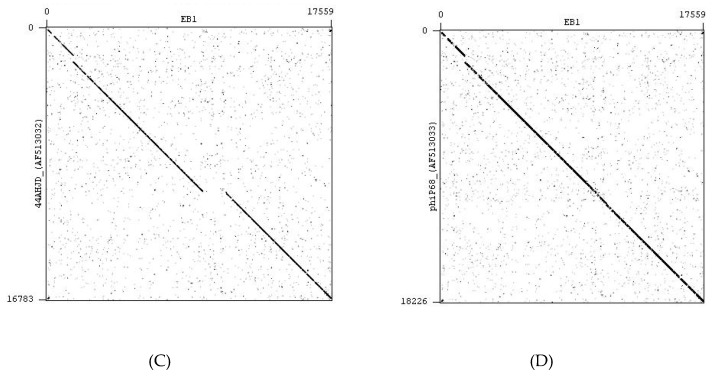
Figure 6.
Local comparison of two phage genomic sequences (dotplot) calculated by Gepard software version 1.40: A—comparison of genomic sequences of phages EB1 and PSa3; B—comparison of genomic sequences of phages EB1 and 66; C—comparison of genomic sequences of phages EB1 and 44AHDJ; D—comparison of genomic sequences of phages EB1 and phiP68.


