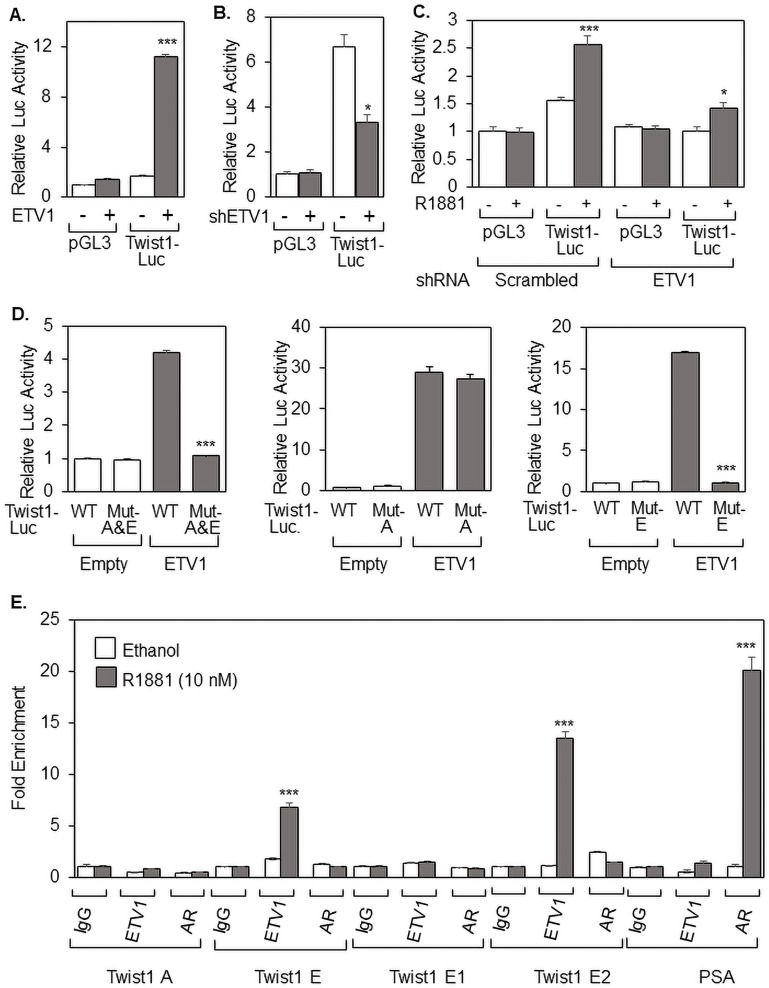
Figure 3. ETV1 activates Twist1 expression through a proximal Ets-responsive region of the Twist1 promoter.
(A and D) HEK cells were co-transfected with pGL3, Twist1-Luc (called WT in D), or Twist1-Luc reporter plasmids mutated for different regions (A, E, or A and E) and ETV1 expression plasmid (+) or empty plasmid (−), as indicated. (B and C) LNCaP cells, grown in either (B) full serum or (C) 2% DCC-serum and treated with ethanol (−) or 10 nM R1881 (+), were co-transfected with pGL3 or Twist1-Luc and scrambled shRNA (−), ETV1 shRNA (+), or empty vector (−), as indicated. The Luciferase activity shown is relative to the activity of pGL3 (−), which was set as 1. (E) ChIP assay was performed with LNCaP cells grown in 2% DCC-serum with ethanol or 10 nM R1881, as shown, to measure recruitment of ETV1 or AR to the Twist1 promoter regions A, E, E1, or E2 and PSA. ChIP values are represented as fold enrichment relative to the IgG control (anti-IgG ChIP, no hormone), which were first standardized to Input. Bar graphs represent averages of three independent experiments plus standard deviations. The Student’s T-test was performed to show statistical significance (*p < 0.05, ***p < 0.01), as indicated by the asterisks.

