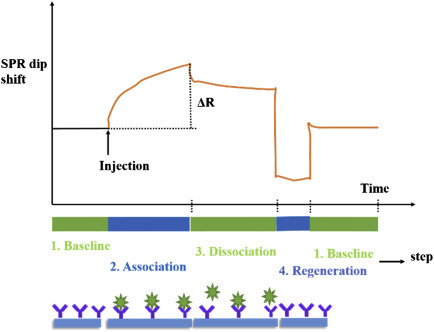
Figure 1.4.9.

A typical sensorgram for detection of biomolecules. Step 1 (baseline) showing buffer is in contact with the biofunctionalized sensor, step 2 (association) is for continuous injection of solution containing target molecules allowing interaction on the sensor surface, and ΔR represents the measured response due to the bound target molecules. Step 3 (dissociation) is for injection-only buffer solution for allowing dissociation of target molecules. SPR, surface plasmon resonance.
